Foreign Direct Investment in the United States 2024
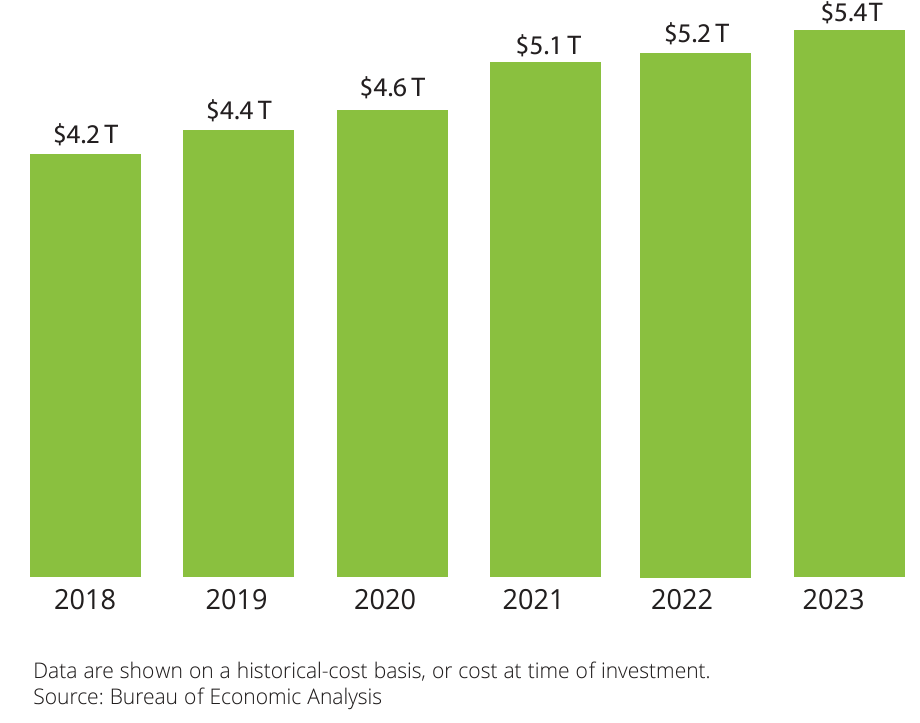
Annual foreign direct investment inflows over the last few years brought total FDIUS to $5.4 trillion through year-end 2023, measured on a historical-cost basis. This is an increase of 29 percent since 2018. The United States was the world’s largest investment destination at the end of 2023. International companies often prefer the United States to other overseas investment destinations because it offers many advantages. First, and perhaps most importantly, the United States has one of the most open markets and investment climates in the world. Other benefits include:

The United States faces stiff global competition for investment dollars; it accounted for 26 percent of the world’s inward stock of foreign direct investment in 2023, down from 27 percent in 2003. And in 2013, the United States’ share of global FDI had dropped to just 20 percent. International investment in the United States has since rebounded, but nevertheless it remains behind developing countries. The European Union’s share of worldwide FDI was 25 percent in 2023, shrinking from 33 percent in 2003.
International companies are investing more in developing economies, with their share increasing by 11 percentage points since 2003. The stock of inward investment in these markets is now much higher than in the United States. By the end of 2023, developing economies recorded large gains and claimed 32 percent of worldwide investment stock. Large developing economies, including China, Hong Kong, Indonesia, and Singapore, were among the beneficiaries. International investment in China jumped from two percent of world-wide investment in 2003 to seven percent last year.
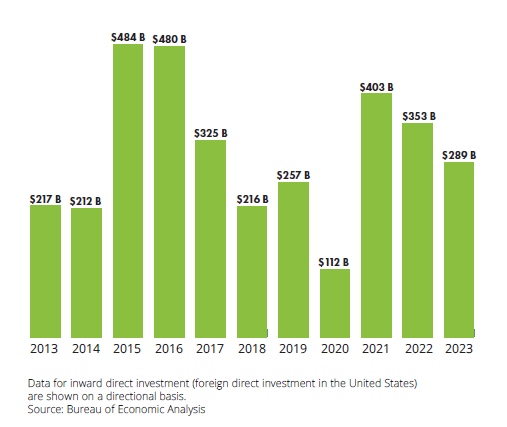
International companies invested nearly $290 billion in the United States last year, less than average over the past decade and down nearly 20 percent from investment flows in 2022. During the COVID-19 pandemic, FDIUS inflows dropped to $112 billion in 2020, the lowest level of the past decade. Inflows then rebounded to$403 billion in 2021.
Multinational companies headquartered abroad invested more than $480 billion in the United States in 2015 and 2016, well above the annual average over this past decade. Foreign direct investment in the United States consists of reinvestment of earnings, equity other than reinvestment of earnings, and debt instruments.

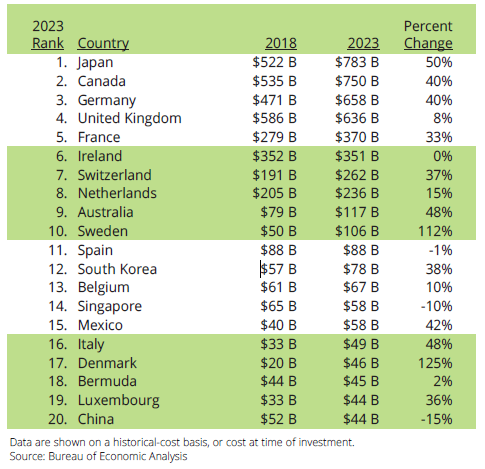
Four countries provided the majority of the $5.4 trillion in cumulative direct investment in the United States by the end of 2023. Japan was the single-largest overseas investor, constituting 15 percent of total cumulative foreign direct investment holdings. Canada, however, was not far behind as the second-largest investor in the United States with 14 percent in FDIUS stock, followed by Germany. Until 2018, the United Kingdom was the largest investor in the United States, but it has since dropped to fourth position.
The eight countries shown in the pie chart accounted for three-quarters of total FDI stock in the United States in 2023. More than 100 other countries represented the remainder.
This report shows country data by ultimate beneficial owner, which reflects the actual ownership of a foreign firm in the United States.
Cumulatively, Europe was the largest regional investor in the United States. It made up 55 percent of all foreign investment through 2022. These figures include the 27 European Union (EU) countries and other European nations with investment stakes in the United States, such as the United Kingdom, Switzerland, and Norway.
The Asia and Pacific region was second, accounting for about a fifth of FDI stock in the United States through 2022, while Canada held 13 percent, ahead of several regions.
In 2022, South and Central America held two percent of FDI stock in the United States while the Caribbean and Atlantic Islands and the Middle East each held about 1.5 percent. Mexico was the largest investor from these regions through 2022, while FDI stock from Bermuda dropped to $39 billion. Investment from Africa remained tiny at $8 billion at the end of 2022, with South Africa accounting for the lion’s share of the continent’s cumulative direct investment in the United States.

Of the top 20 countries by cumulative direct investment in the United States at year-end 2023, two Scandinavian countries–Denmark and Sweden–both more than doubled their investment stock between 2018 and 2023. During the last five years, companies from both countries increased their investments substantially in the U.S. wholesale trade sector, with Sweden nearly quadrupling its investments to $23 billion through 2023.
Japan was not only the largest investing country last year, but also the third fastest-growing country by FDIUS between 2018 and 2023. Australia and Italy both increased their FDIUS stock by 48 percent over the past five years.
Between 2018 and 2023, Canada, Germany, and Mexico each increased its investment stake in the United States by at least 40 percent.
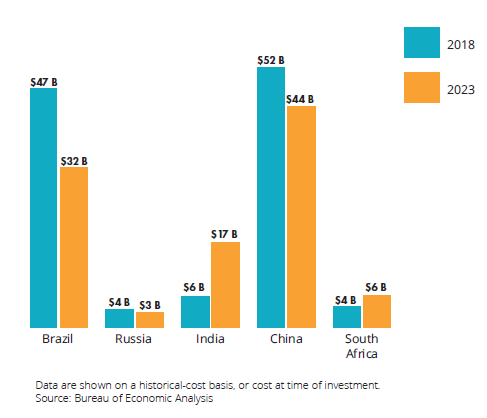
The five major emerging economies of Brazil, Russia, India, China, and South Africa are known collectively as BRICS. Despite the size of their economies, combined BRICS’ investment registered less than two percent of all foreign investment stock in the United States at the end of 2023; as a group, its investment dropped 10 percent from 2018. China ranked as the largest BRICS investor with $44 billion through 2023. However, its investment dropped by 15 percent over the past five years. Russia’s tiny cumulative direct investment of some $3 billion in the United States shrank by nearly 20 percent during the same period.
At $17 billion through 2023, India was the third-largest BRICS investor in the United States and the fastest growing, with Indian investments almost tripling over the last five years. Brazilian FDIUS dropped 33 percent between 2018 and 2023. South Africa’s cumulative investment registered $6 billion by the end of last year, growing nearly 50 percent since 2018.
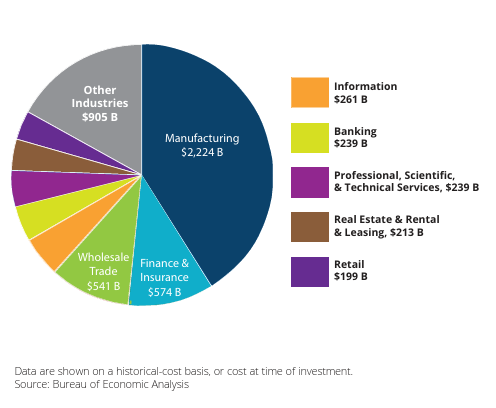
International companies are attracted to all sectors of the U.S. economy. At $2.2 trillion in 2023, manufacturing accounted for 41 percent of total foreign direct investment stock. Because the United States has the world’s largest and most liquid financial markets, international companies, on a cumulative basis, have invested heavily in the U.S. finance and insurance industries, at $574 billion by year-end 2023, growing more than 20 percent since 2018.
Wholesale trade accounted for 10 percent of total foreign direct investment at the end of 2023. The information sector received $261 billion in cumulative foreign direct investment through 2023, followed by banking and professional, scientific, and technical services. International investment in real estate totaled more than $210 billion through 2023, while international companies invested $199 billion in retail.

Of the largest industries, cumulative foreign investment in America’s retail trade sector grew the fastest, rising to $199 billion in 2023 from $136 billion in 2018. Food and beverage stores was the largest subsector, with foreign investment stock more than doubling over the past five years. This suggests large acquisitions in the segment.
Cumulative FDIUS in the real estate and rental and leasing sector grew more than 35 percent during the same period.
Manufacturing, the largest industry sector by FDIUS, rose 29 percent over the last five years. International companies added a half trillion dollars to manufacturing FDIUS stock.

International firms invested heavily in the U.S. manufacturing sector. Chemicals garnered $767 billion in total FDI stock by the end of 2023, representing 34 percent of all foreign investment in domestic manufacturing. International companies spend billions annually in the U.S. chemicals industry because it boasts a highly educated workforce, world-class research centers, strong intellectual property protections, and a robust regulatory system. Two-thirds of all FDI stock in U.S. chemicals was in pharmaceuticals and medicines.
Multinational companies invested some $230 billion in the U.S. transportation equipment sector by year-end 2023, mostly in the production of motor vehicles, bodies and trailers, and parts. International investment in the computers and electronic products segment was the third-highest in manufacturing at $195 billion. Beverages and tobacco products was the fourth-largest sector by international investment stock, at $166 billion through 2023.
International investments in this crucial U.S. industry will be bolstered with the recent enactment of the CHIPS and Science Act. The new law includes grants, research investments, and an investment tax credit aimed at strengthening domestic chip manufacturing.
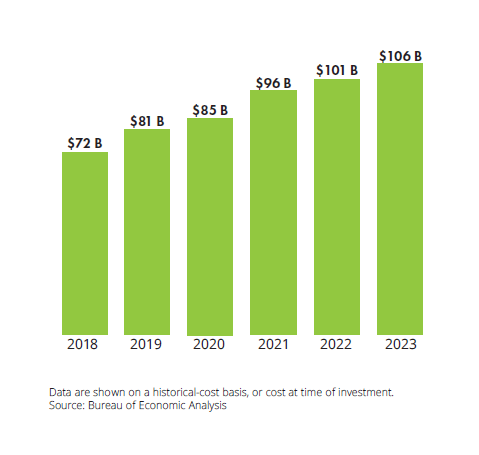
Over the next few years, BEA reported more than $50 billion in planned FDIUS expenditures were announced in the semiconductor sector in 2022. Foreign chipmakers, such as Taiwan Semiconductor Manufacturing Company and Samsung, aim to increase their U.S. fabrication capacities and construct new multibillion-dollar chip facilities in the United States.

International investors added $35 billion to the FDIUSstock in the U.S. primary and fabricated metals sector over the last five years, translating to a growth rate of nearly 50 percent. These companies produce metal products (e.g., steel and aluminum) and fabricated metals (e.g., through forging, stamping, and machining). Partly driving this growth is the “Made in America” production requirement for primary and fabricated metals used in all federally funded infrastructure projects.
Sweden at $15 billion and Japan at $13 billion are the two largest countries by cumulative FDIUS in this sector hrough 2023. The United Kingdom, Australia, France, and Germany have also invested heavily in the U.S. primary and fabricated metals industry. Together, internationalcompanies employ more than 166,000 Americans in thisindustry.
In 2023, international firms indicated they plan to invest an additional $4.5 billion in primary and fabricated metals. This sector could see an additional boost if the U.S. government approves the pending Nippon-U.S. Steel deal. It is currently under review by the Committee on Foreign Investment in the United States.